
Welcome to our demographic data visualization tool, designed to transform the way you understand and interact with data insights. Our SaaS application, powered by Microsoft’s Azure and integrated with Power BI, offers a seamless experience, empowering you to unlock valuable information and transform it into actionable intelligence.
 

Visualize Data on a Map

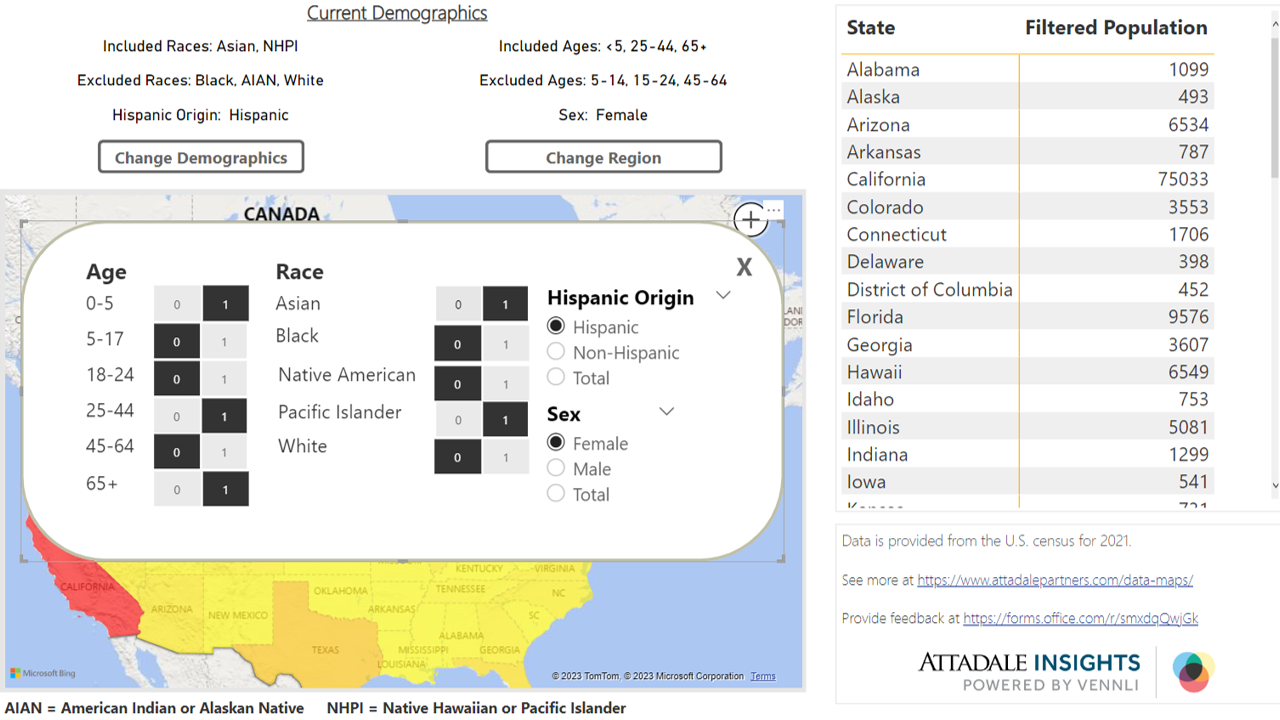
With our innovative tool, you can effortlessly transform complex demographic data into intuitive and visually captivating maps. Easily identify patterns, trends, and correlations, enabling you to make data-driven decisions with confidence. And the best part? We’re constantly expanding our data sets and visuals every month, ensuring you have access to the latest and most comprehensive demographic information.

Uncover Insights at Your Fingertips

No more sifting through spreadsheets and struggling to extract meaningful insights. Effortlessly access real-time demographics, filter information, and compare data across different regions.

Dive Deep into Demographics

Go beyond the surface with - explore age groups, ethnicities, household sizes, and more.

Dive into income, employment, education, and more. With our comprehensive database, gain a deeper understanding of target markets and tailor your strategies accordingly.

Continual Expansion and Customization

Stay ahead of the curve, with regularly added data sets and expanded visual offerings every month.

Personalize your visualizations, apply filters, and save your preferred settings. Every business is unique, and we're here to support your specific needs.

Seamlessly Integrated with Power BI

Harness the power of Microsoft's Power BI by combining the capabilities of our data visualization tool with Power BI's analytics features. Unlock the full potential of your data and take your analysis to new heights.

Free ‘Global Real Estate Company’ case study

Get a free printable copy of this case study.